

Industries
Location intelligence for the luxury market.
Identify the locations, properties and households most likely to be interested in your luxury products and services. AdMapia helps luxury brands understand where their best customers live, how they behave online and which locations drive the highest value customers.
Illustrative property profile · fictional example values
Understand your audience
Find the best locations for luxury customers.
Explore postcode areas using property, demographic and geographic data to identify the places most likely to contain your ideal luxury customers.
- Higher share of detached and high-value homes
- Larger floor areas and premium property types
- Owner-occupation and affluent household profiles
- Rural and semi-rural locations
- Income and lifestyle indicators
- Property and household density
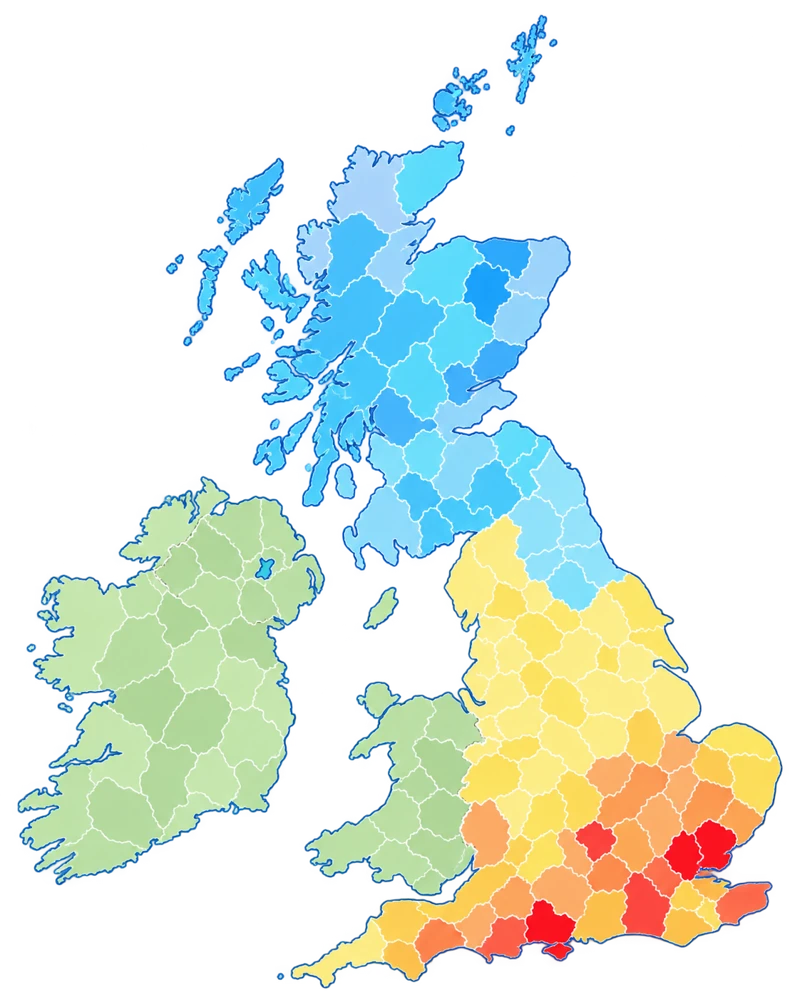
Luxury opportunity score
- Very high
- High
- Medium
- Low
- Very low
Top postcode districts
| Postcode | Opportunity score | Avg. property value |
|---|---|---|
| KT22 | 98 | £1,245,000 |
| SL6 | 96 | £1,102,000 |
| OX7 | 94 | £966,000 |
| RG9 | 92 | £932,000 |
| RH15 | 90 | £874,000 |
| GU25 | 88 | £812,000 |
| W8 | 86 | £768,000 |
| TW12 | 84 | £726,000 |
| AL5 | 82 | £721,000 |
| BH23 | 80 | £666,000 |

Understand customer behaviour
See how luxury audiences behave online.
Connect postcode and property cohorts with website behaviour to understand how people from different areas engage with your brand.
- Pages viewed and products researched
- Planning tools and configuration usage
- Add-to-cart activity and downloads
- Return visits and journey length
Conversion & revenue
Discover what drives your highest value customers.
Compare converters against non-converters to identify which postcode and property characteristics are associated with stronger outcomes.
- Revenue, AOV and ROAS by location
- Conversion drivers by property characteristics
- Influential property signals
- Compare high-value vs. lower-value customers
Revenue by property type
Key property signals for high-value customers
Example luxury categories
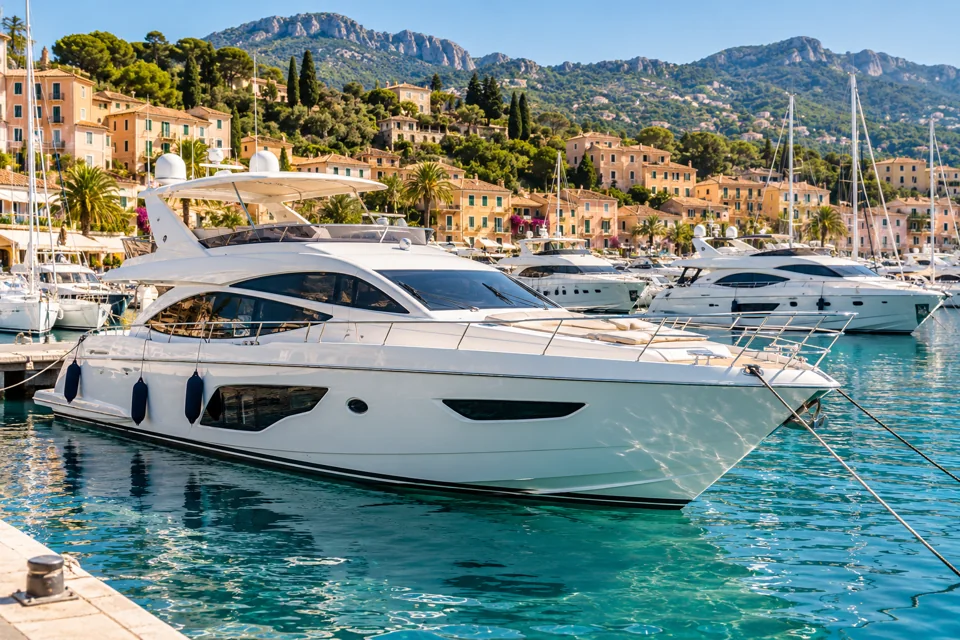
Different luxury products attract different locations.
The type of luxury product or service can be linked to specific property types and locations. From high-end homes and gardens to luxury travel and lifestyle products, AdMapia helps you find the right audiences.


Turn insights into action
Target with confidence and reach more luxury customers.
Use the insights to refine your targeting, allocate budget more effectively and find new high-potential locations.
- Geographic targeting and bid adjustments
- Campaign structure and budget allocation
- Product-specific location strategies
- Lookalike postcode discovery
- Test and measure to continuously improve
Top lookalike postcode districts
| Postcode | Lookalike score | Opportunity | Avg. property value |
|---|---|---|---|
| OX14 | 96 | Very high | £1,012,000 |
| RG10 | 94 | High | £875,000 |
| SL5 | 92 | High | £641,000 |
| KT20 | 90 | High | £760,000 |
| GU3 | 88 | Medium | £736,000 |