
NORTH YORKSHIRE AREA · LOCATION INTELLIGENCE
Where Are North Yorkshire’s Best Glazing Customers?
Find your next leads with Location Intelligence & AI agents.
Request your free customised Growth Report →
Estimated monthly searches
in North Yorkshire
1,220UK benchmark: 72,100 · total estimated searches
Cost per Click comparison
in North Yorkshire
-3.4% vs UK avgLocal mean: £6.72 · UK benchmark: £6.95
Competition index comparison
in North Yorkshire
-1.4% vs UK avgLocal mean: 93.2 · UK benchmark: 94.5
Local property contrast
12.8×Variation in recorded single or partial multiple glazing across selected postcode districts · historical proxy
Keyword estimates and property evidence remain separate. CPC means use paired keyword groups; not actual advertiser costs.
Customer Signals from Property Data
Customer signals from recorded property evidence.
Largest postcode contrast
1,183.3%Higher than the lowest non-zero postcode
Recorded single or partial multiple glazing
Highest: LA10 · 39.3%
Lowest: DL9 · 3.1%
Postcode differences help focus geographic tests; validate the strongest signals with your own enquiries.
Average house price comparison
253.4%Higher than the lowest postcode average
Highest: LS17 · £621,417
Lowest: DN6 · £175,819
Local sale prices help frame standard and premium offer tests; they do not establish household budgets or buying intent.
Average recorded house sale prices, 2023-2025. At least 30 sales per district; houses only. Historical prices, not current valuations.
Recorded single or partial multiple glazing
1,183.3%Higher than the lowest non-zero postcode
Highest: LA10 · 39.3%
Lowest: DL9 · 3.1%
Single or partial multiple glazing helps identify areas to investigate replacement-glazing offers.
Recorded replacement-window recommendations
458.7%Higher than the lowest non-zero postcode
Highest: LA10 · 23.4%
Lowest: LS25 · 4.2%
Recorded replacement recommendations help prioritise areas for a current suitability check.
Percentage increase = (highest share / lowest non-zero share - 1) x 100. Calculated before rounding. EPC comparisons exclude shares displayed as 0.0% and use postcode districts with at least 100 valid records for each signal. Historical property signals guide investigation; they do not establish current purchase intent.


Why local context matters
Replacement windows and doors in North Yorkshire need messages suited to the properties and customers you serve. The retained owner-occupied EPC cohort contains 141,563 properties across 70 named postcode districts. Use the recorded glazing signals to select questions and geographic tests, then validate them with your enquiries.
Explore your offer alongside local property characteristics, customer enquiries and the wider area context. Treat product-fit ideas as hypotheses to validate with your company’s evidence.
Property metrics use current administrative North Yorkshire UPRN membership. Google Ads uses its independently resolved same-name County target; boundaries are not assumed identical. Separate unitary areas are excluded from the property cohort. Property analysis uses dated ONS UPRN membership in the specified current administrative area. Location source
A preview of the local evidence
Recorded single or partial multiple glazing varies across the recorded North Yorkshire postcode cohort. This is a historical property signal to investigate, not proof that households need new windows.
Request the full report for more areas and all three signal definitions.
| Postcode | Recorded share | Valid records |
|---|---|---|
| LA10 | 39.3% | 107 |
| HG5 | 14.1% | 4,090 |
| DL9 | 3.1% | 1,602 |
Highest, middle and lowest shares among districts with at least 100 valid records. Districts can overlap county boundaries; only properties with UPRN membership in North Yorkshire are included.
Make this Growth Report about your company
Get a personalised brief combining relevant advertising insights, location evidence and tailored recommendations for your business.
Request your free customised Growth Report →Inside your personalised Growth Report
Local market context
Housing, area characteristics and the questions to explore for your product.
Postcode insights
A detailed look at the agreed geography, relevant signals and their coverage.
Advertising opportunities
Practical hypotheses for audience targeting, messaging and campaign tests.
Understand your audience
Save money on your advertising with location targeting.
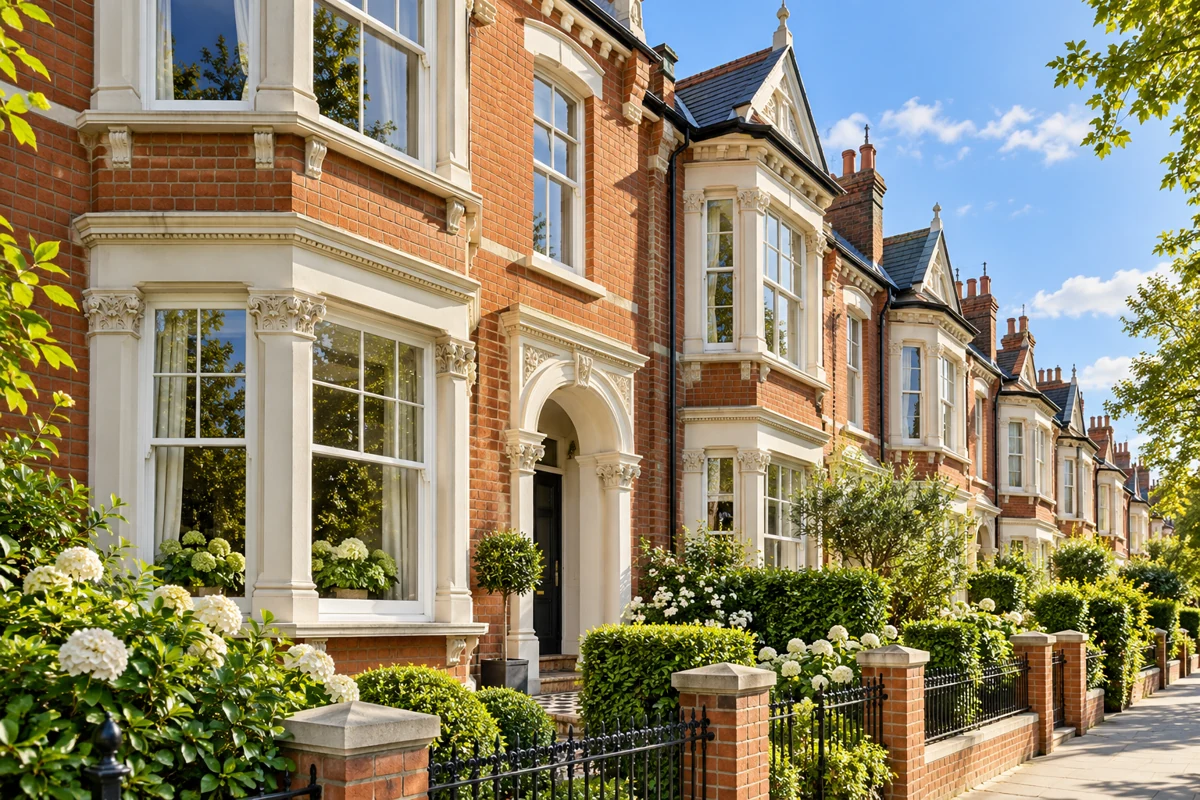
Explore postcode areas using property, demographic and geographic data to identify the places most likely to contain your ideal customers for different window and glazing products.
- Different property types (modern vs. period)
- Detached, semi-detached and terraced homes
- Property age and built form
- Owner-occupation and household profiles
- Income and lifestyle indicators
- Property and household density
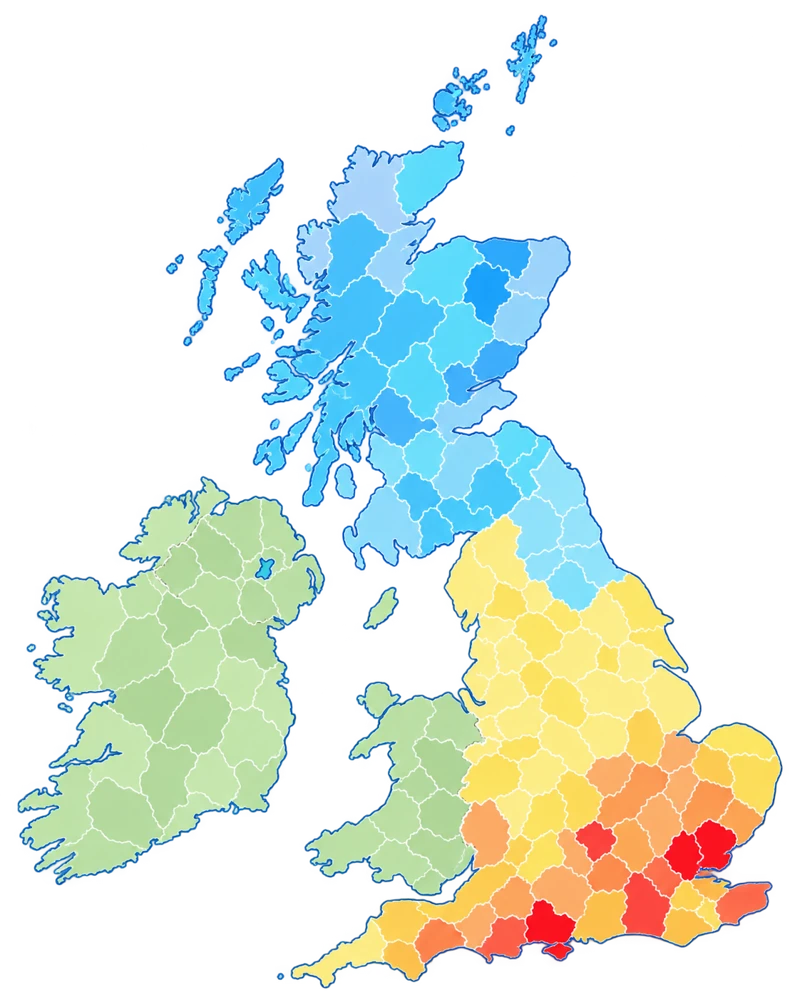
Window & glazing opportunity score
- Very high
- High
- Medium
- Low
- Very low
Top postcode districts
| Postcode | Opportunity score | Avg. property value |
|---|---|---|
| KT22 | 98 | £725,000 |
| SL6 | 96 | £682,000 |
| OX7 | 94 | £614,000 |
Understand customer behaviour
See how window and glazing audiences behave online.
Connect postcode and property cohorts with website behaviour to understand how people from different property types and locations engage with your brand.
- Pages viewed and products researched
- Use of configurators and quote tools
- Add-to-cart activity and downloads
- Return visits and journey length
Conversion & revenue
Discover what drives your highest value customers.
Compare converters against non-converters to identify which postcode and property characteristics are associated with stronger outcomes.
- Revenue, AOV and ROAS by location
- Conversion drivers by property characteristics
- Influential property signals
- Compare high-value vs. lower-value customers
Revenue by property type
Key property signals for high-value customers
Two offers to test with owner-occupiers
Standard replacement offer
Test practical messages about replacement double glazing, uPVC windows and doors, and composite-door options, with clear installation and quotation information.
Premium design offer
Test aluminium windows, bespoke finishes and higher-specification door options. Investigate heritage and conservation requirements before proposing changes.
These are marketing offer segments, not classifications of household wealth or material preference. Both offers need company-specific enquiry and conversion validation. EPC window signals do not establish door condition.
Companies serving the North Yorkshire area
 Lifetime WindowsServes this areaS & K WindowsServes this area
 Niddal WindowsServes this area
 ElimentsServes this area
 DGMSServes this area
 EYG Domestic LimitedServes this area
 House of Windows LtdServes this area
 Chatsworth WindowsServes this area
 NYG Home ImprovementsServes this area
 Carrs Windows LtdServes this area
Verified product/service and area evidence. A researched directory, not an exhaustive register or endorsement.
Company services and source evidence
- Lifetime Windows: Us Inspiration Gallery Our Process Case Studies Our Story Meet The Team Contact Us We are North Yorkshire's premier manufacturer and installers of uPVC Source · verified 2026-10-15
- S & K Windows: n since 2002 Windows, doors & conservatories, done properly. Quality installations across North Yorkshire, Durham and Cleveland — quietly, tidily, and without the hard Source · verified 2026-10-15
- Niddal Windows: ce 1977 At Niddal, we offer a wide range of double glazing solutions across Harrogate and North Yorkshire. From energy-efficient windows and doors to Source · verified 2026-10-15
- Eliments: lity uPVC windows York, doors, conservatories and glazing solutions for homeowners across North Yorkshire. Whether you need front door installation, new door installation, window Source · verified 2026-10-15
- DGMS: dicated to providing exceptional double glazing services, enhancing homes across York and North Yorkshire with quality and care. All staff are employees so no Source · verified 2026-10-15
- EYG Domestic Limited: North Yorkshire Windows And Doors | Double Glazing by EYG Windows Flush Casement Windows Sliding Sash Windows Tilt and Turn Windows Coloured uPVC Windows Source · verified 2026-10-17
- House of Windows Ltd: UPVC Windows North Yorkshire | Double Glazed Windows UPVC Windows in North Yorkshire 0 Total: £0 Call Us 01530 515161 WhatsApp 07427 935161 Mon-Fri: Source · verified 2026-10-17
- Chatsworth Windows: e Process Contact Us FAQ's Our Location Chatsworth Windows, Yafforth Road, Northallerton, North Yorkshire, DL7 8UE Contact Us enquiries@chatsworth-windows.co.uk 08000 852780 01609 780444 Facebook Source · verified 2026-10-17
- NYG Home Improvements: nd personal recommendations. Try NYG and join thousands of satisfied customers throughout North Yorkshire. Call 01609 770581 BOOK A FREE QUOTE [grw id=1122] View Source · verified 2026-10-17
- Carrs Windows Ltd: specialist timber types available on request. Areas covered: Skipton & Craven District | North Yorkshire | West Yorkshire | Lancashire & Pendle | Ribble Source · verified 2026-10-17
The opportunity for your business
For selected Windows & Doors keyword groups, mean historical CPC in North Yorkshire is 3.4% lower than the UK benchmark.
- ✓Explore relevant customer segments and offers
- ✓Compare geographic tests using the same campaign assumptions
- ✓Measure cost per lead and conversion quality with your own results
- ✓Review your spend alongside customer and location evidence
Your report is personalised to your company. If these area averages do not fit your business, let’s talk. Actual client results are needed to estimate returns or savings.
Mean historical keyword CPC: North Yorkshire vs UK
-3.4% vs UK · 6 paired keyword groups
Google Ads Keyword estimates. This is a keyword-group mean, not actual advertiser account CPC.
Bring your advertising and location intelligence together
Discuss the campaign support that fits your company and your next test.
Audience targeting
Conversion measurement
Location-based campaigns
Ongoing reporting
Competitor research
FEATURES
Business Tools included in the service
Property evidence. Location analysis. Better-informed advertising decisions.
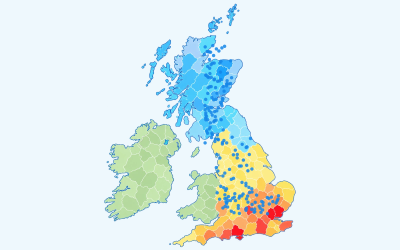
◎Understand your existing customers
Explore customer location patterns and relevant property characteristics.
 Discuss this in your report →
⌕Find more customers like them
Investigate areas with similar characteristics, then validate them against your customer evidence.
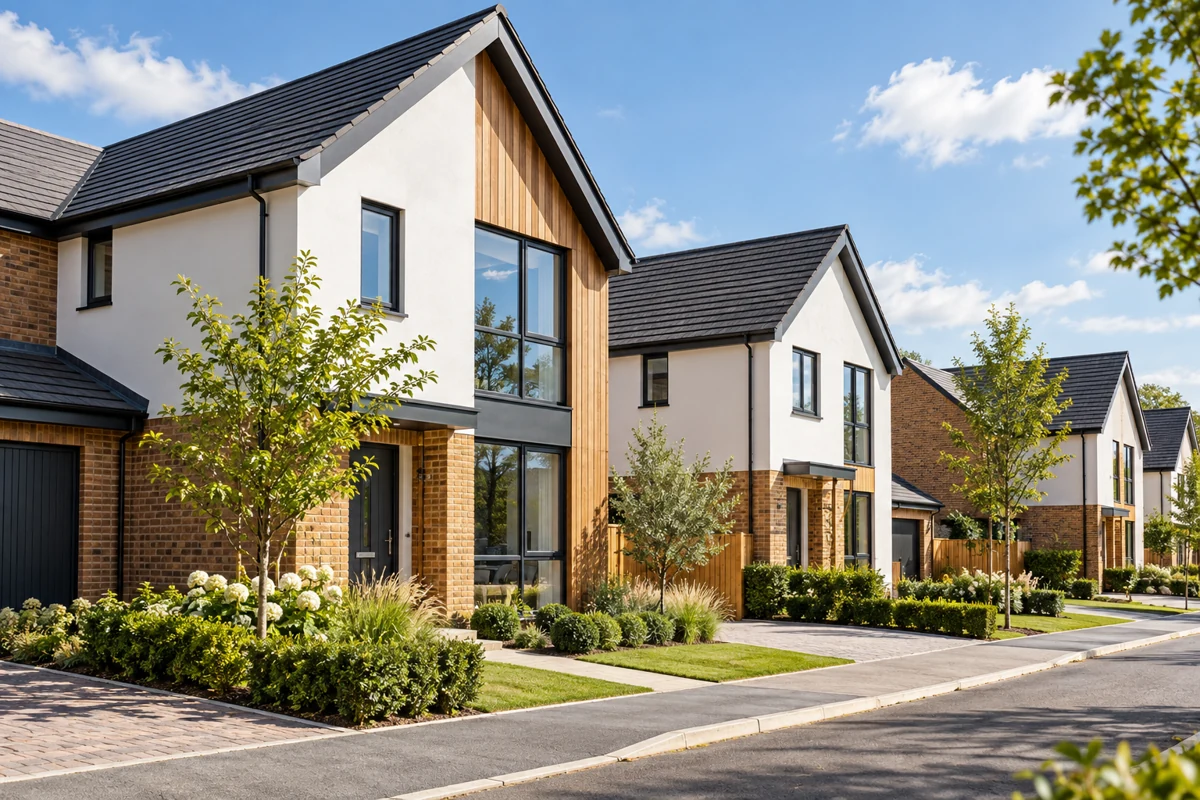
Discuss this in your report →⌂Powerful property intelligence
Explore relevant property age, type, tenure, energy efficiency and other available fields.
 Discuss this in your report →
◇Smarter geographic targeting
Compare supported postcode and area groupings to build measured campaign tests.
 Discuss this in your report →
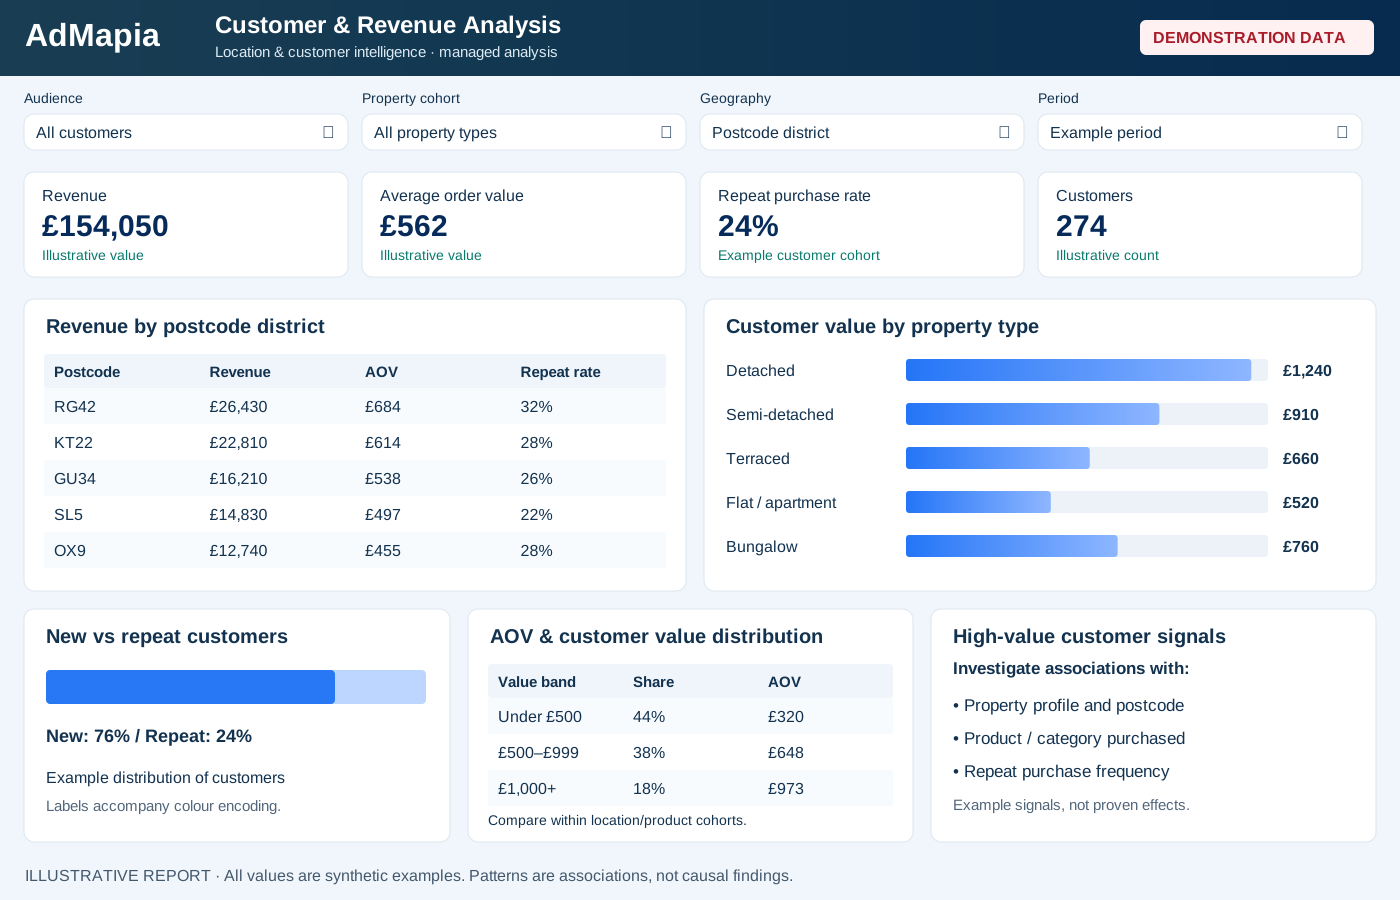
▥Visual location intelligence
Review geographic patterns and source coverage to see where to investigate next.
 Discuss this in your report →
↗Build better advertising audiences
Translate approved insights into practical Google Ads geographic tests where the platform supports them.
Discuss this in your report →Home-page visuals are illustrative, not measured results or targeting coverage.
Request your free customised Growth Report
Tell us about your company, service area and customers. We will agree your brief before preparing the report.
Complete the web form with your company, products and service area. We will agree your report brief with you.